Foundation Degree in Business and Management (Year 2)
Business Finance
School of Business, Management and Professional
Semester: 1
TITLE: Business Performance
Completion of this work will satisfy the following learning outcomes from this module:
LO4 Analyse financial data using a variety of financial tools to draw conclusions
Task
In preparation for this practical task you are provided with financial data for a given business (see case study below). Within the assessment, you will use a number of financial tools to analyse the financial information presented in order to assess the performance of the business.
CASE STUDY
You have been asked to analyse the financial management of T plc, a retailer. The ratios for the last three financial years for T plc were:
|
T plc
|
2020
|
2019
|
2018
|
|
Gross profit margin %
|
40
|
40
|
39
|
|
Net profit margin %
|
6.05
|
5.9
|
5.8
|
|
Return on shareholders’ funds %
|
16
|
15.25
|
15
|
|
Current ratio
|
0.8:1
|
0.95:1
|
1.1:1
|
|
Quick ratio
|
0.4:1
|
0.55:1
|
0.65:1
|
|
Inventory holding days
|
13
|
12
|
13
|
|
Receivables days
|
6
|
6
|
8
|
|
Earnings per share
|
25p
|
23p
|
23p
|
|
Price earnings ratio
|
25
|
22
|
20
|
|
Dividend Yield %
|
3
|
4
|
3
|
|
Most Recent Industry Averages for retailers
|
|
Gross profit margin %
|
37
|
|
Net profit margin %
|
4
|
|
Return on shareholders’ funds %
|
12
|
|
Current ratio
|
1.05:1
|
|
Quick ratio
|
0.5:1
|
|
Inventory holding days
|
19
|
|
Receivables days
|
2
|
|
Earnings per share
|
-
|
|
Price earnings ratio
|
22
|
|
Dividend Yield %
|
3
|
Required:
Critically evaluate the performance of T plc over the 3-year period considering the industry averages. Your answer should include an analysis of the following:
Profitability
Liquidity
Working capital management.
Stock market performance (Investment Ratios)
As a potential investor, would you invest in T plc? Justify your choice.
Note: State clearly any limitations/assumptions that you need to make to answer the above questions.
Other relevant assessment information:
You will submit online, through Turnitin, your analysis and evidence of the financial tools you have used to measure business performance on the day of the assessment. 1000 word +/- 10%. Ensure you submit both a bibliography and reference list.
The completion of your work will satisfy 25% of the assessment for this module
Issue Date: 15.07.2021
Submission Date: 27.09.2021
Feedback Date: 29.10.2021
SKILLS DEVELOPMENT
Ability to apply and analyse financial data
Analysis of financial information using tools to explore business performance
Presentation of conclusion and judgments using financial business terms
Research skills to reflect on financial information
Critical evaluation of financial information
MARKING CRITERIA
|
Task - Business Report on the following:
|
Indicative Content
|
Marks allocation %
|
|
Business Performance Analysis – a practical task using financial tools (ratio analysis and interpretation).
|
Identify the theory used, explain what they mean and using the data provided offer critical comments on:
Summary/recommendations: demonstrate an analytical and evaluative approach to measuring business performance.
As a potential investor, would you invest in S plc? Justify your choice.
Overall presentation - This should be coherent, logically organised, and clearly expressed. They should be accurate in terms of spelling, grammar and punctuation.
Appendices should contain material relevant to supporting the assignment.
Referencing:
Your references are from quality sources such as articles; textbooks and other peer-reviewed journals
|
20%
10%
10%
20%
15%
20%
5%
|
| |
|
100%
|
Undergraduate Generic Marking Criteria Foundation Degree Level 5
|
Level 5 (Foundation Degree/Diploma)
|
Classification
|
Level 5 (Foundation Degree/Diploma)
|
Classification
|
Level 5 (Foundation Degree/Diploma)
|
Classification
|
|
90%-100%
Exceptional work with presentation of the highest standard. The work contains coherent arguments and ideas. There is a detailed understanding of subject matter and critical analysis of issues/problems. Points are made clearly and concisely, always substantiated by appropriate use of source material. There is evidence of a sound ability to critically interrelate theories with examples from practice where appropriate.
|
Distinction*
|
80%-89%
Outstanding work with the presentation of a very high standard. There is a comprehensive understanding of key concepts and knowledge and evidence of critical analysis and insight. Accurate interpretation of data with arguments, ideas and solutions presented effectively and based on strong research and reading.
|
Distinction*
|
70%-79%
Extremely good work with the presentation of a high standard. Evidence of strong knowledge and understanding together with some critical analysis and insight. Source material is used effectively to support arguments, ideas and solutions.
|
Distinction*
|
|
60%-69%
Very good presentation. Sound knowledge and understanding with an emerging ability to critically engage with and apply the concepts involved linking them to practice where appropriate. Good use of source material that supports most points clearly. Content is wholly relevant and is coherently structured.
|
Distinction
|
50%-59%
Presentation is of a good standard but some shortcomings. Evidence of a sound knowledge base but the limited critical and practical application of concepts and ideas. Content is largely relevant although points may not always be clear and structure may lack coherence. Contains some critical reflection and some use of source material to illustrate points.
|
Merit
|
40%-49%
Adequate presentation. The work is descriptive and/or lacks critical analysis where required but is relevant with limited though sufficient evidence of knowledge and understanding. There is some evidence of reading although arguments/ proposals/solutions often lack coherence and may be unsubstantiated by relevant source material or partially flawed. Links to practice are made where appropriate.
|
Pass
|
|
30%-39%
Poorly structured, incoherent and wholly descriptive work. Evidence of a weak knowledge base with some key aspects not addressed and use of irrelevant material. Flawed use of techniques. Limited evidence of appropriate reading and no evidence of critical thought. Little reference to practice where appropriate.
|
Fail
|
20-29%
Very poorly structured, incoherent and wholly descriptive work. Evidence of a very weak knowledge base with many key omissions and much material irrelevant. Use of inappropriate or incorrect techniques. Very little evidence of appropriate reading and no evidence of critical thought. No links to practice where appropriate. To obtain a mark of 20% the work must show evidence of a genuine attempt to engage with the assessment requirements and with the subject matter.
|
Fail
|
0-19 %
The work is extremely poorly structured and presented. It demonstrates no real knowledge or understanding of key concepts and principles. Much material is irrelevant, incorrect or omitted. No evidence of critical thought. No effective use of supporting material. No links to practice where appropriate. Not a genuine attempt to engage with the assessment requirements and/or subject matter.
|
Fail
|
Introduction
The study covers a detailed analysis of the overall financial performance of T Plc along with the comparison of the company’s performance with the industry average. For this purpose, available information of ratios of T Plc and industry average has been used. The aim of the study is to determine whether an investor should invest in the company’s shares or not.
Main Body
Task
(a) Profitability:
This criterion evaluates how efficient T plc is in terms of profit generation. Here following are vital profitability ratios and their analysis of T Plc, as follows:
Gross Profit Ratio:
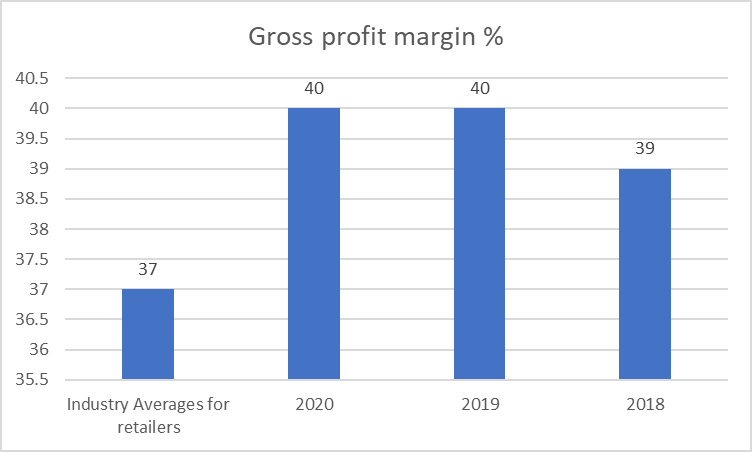
Analysis: GP ratio represents a business’s effectiveness to generate profit from its fundamental operational activities without considering indirect business expenses (Husain, and Sunardi, 2020). As depicted in the aforementioned graph, T plc’s gross profit ratio has been increased from 39% to 40% from 2018 to 2020 implying an increasing upward trend. Also, T plc’s GP ratio is greater than the industry average in 2020. This trend and comparison show that T plc’s efficiency to produce profits through core business activities has been increased.
Net Profit Profit:

Analysis: NP ratio presents entity’s efficiency status in terms of generation of net profit considering all business expenses. NP ratio of T plc for the year 2018 was 5.8% which has been increased to 5.9% in 2019 and 6.05% in the year 2020 reflecting a rising trend in T plc’s NP ratio. This rising trend of NP shows that T plc’s profitability performance relating to NP generation has been increased over the stated period. Further, the comparison of the NP ratio of T plc with industry average NP reflects that company’s performance in NP generation is better than the industry average (Rahman, 2017).

Analysis: Return on Shareholder’s fund or Return on equity (ROE) of T Plc exhibits that in 2018 company’s ROE was 15% in 2018 which risen to 15.25% in 2019 and 16% in 2020 indicating a rising trend in ROE of company. Such trend signifies that T plc’s profitability performance in terms of providing profits or returns to shareholder has been enhanced over 2018-2020. Moreover, the graph shows that T plc performed well in comparison to the Industry average standard (Laitinen, 2017).
Based on the analysis of the overall profitability performance of T plc this has been ascertained that T plc’s profitability performance has been improved over the period 2018-2020. Also, T Plc's profitability performance is much better as in comparison to the industry average standards.
(b) Liquidity:
Current Ratio:
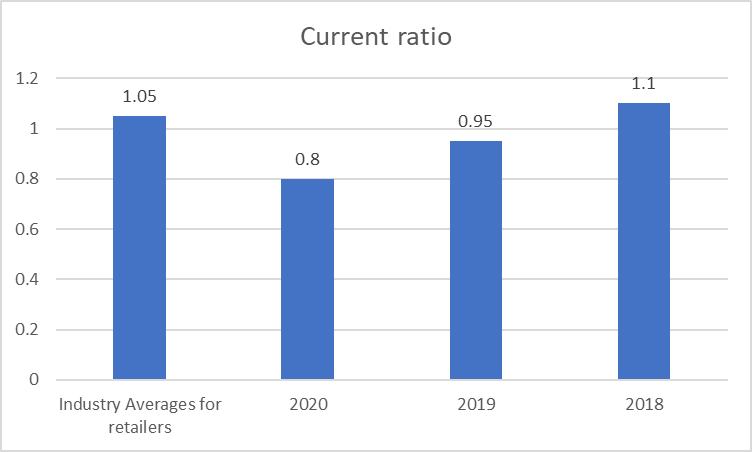
The current ratio of T Plc was 1.1 in 2018 which has been dropped to 0.95 (in 2019) and 0.8 (in 2020) implying an overall declining trend. This downwards current ratio trend implies that T plc’s shorter-range liquidity position has been dropped during 2018-2020. A notable aspect here is that company’s current ratio is below the benchmark i.e. industry average suggesting poor short-term liquidity status (Sartika, Muin, and Sofyan, 2021).
Quick Ratio:

Analysis: As presented in the above graph, T plc’s quick ratio has been declined from 0.65 (2018) to 0.55 (2019) and reached 0.65 (2020) implying a quick ratio’s declining trend. This downward is unfavorable for the company as it indicates a decrease in the cash-liquidity position of the company. In 2020, T plc’s quick ratio is lower than the sector average implying a poor cash liquidity position comparatively (Sari, 2021).
The overall liquidity position of T Plc has been dopped in 2020 which is assumed to be due to COVID-19 circumstances.
(c) Working capital management:
Inventory Holding Days:
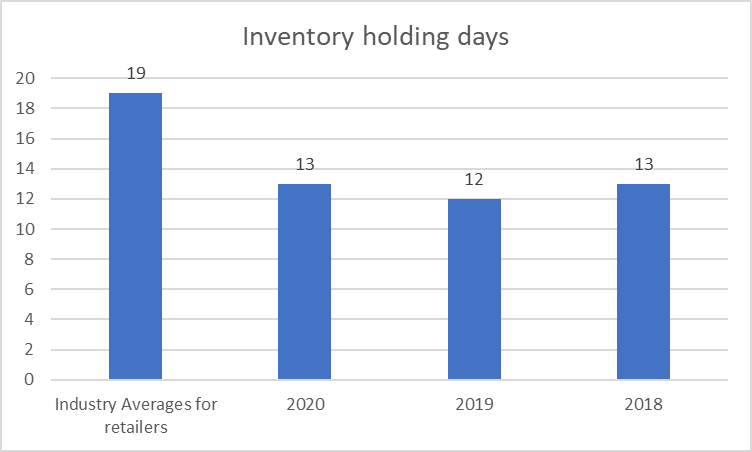
Inventory holding days of T Plc reported no significant change as in 2018 T plc’s inventory holding period was 13 which reached 12 days (in 2019) and 13 days (in 2020). Industry average Inventory Holding days is 19 days while T plc’s Inventory Holding days are 13 days which shows that the company performed well in comparison to industry standard. The analysis reflects that company is quicker to convert inventories into sales in contrast with the industry benchmark (Tiruvengadam, and Beruvides, 2020).
Receivable Days:
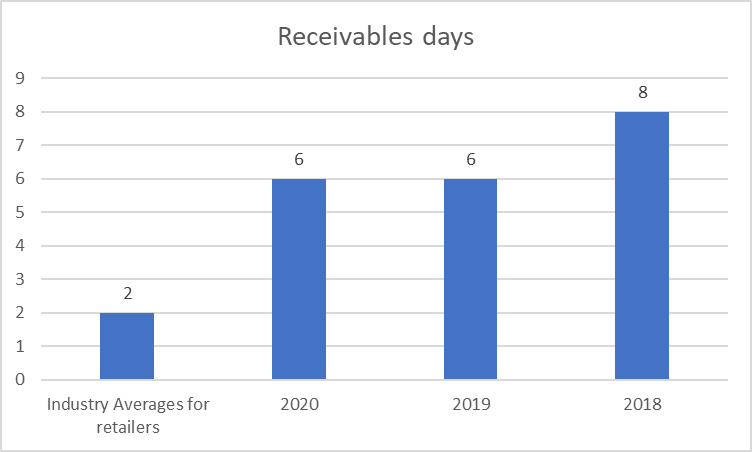
The receivable days of the company were 8 days in 2018 which improved and reached 6 days in 2019 and 2020 implying a favourbale trend in ratio. This favorable trend shows that T plc’s potential in terms of collection of cash from trade receivables has been improved during 2018-2020. Moreover, T Plc’s receivables days are less than the industry average which shows T Plc is not performed well in cash collection from debtors than industry’s average companies (Jana, 2018).
(d) Stock market performance (Investment Ratios):
PE Ratio:
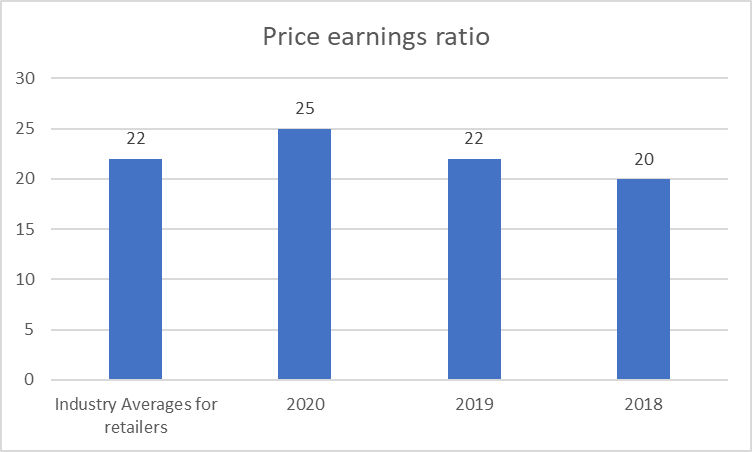
PE ratio of T plc was 20 in 2018 which risen to 22 in 2019 and 25 to 2020 reflecting an incremental trend in T Plc’s PE ratio. This rising trend of PE implies that T plc’s efficiency to provide a return on each share of the company in proportion to the current price of share has been improved. Also, an Increasing PE ratio denotes enhanced demand since investors foresee prospective earnings growth (Rukshika, 2019).
EPS:
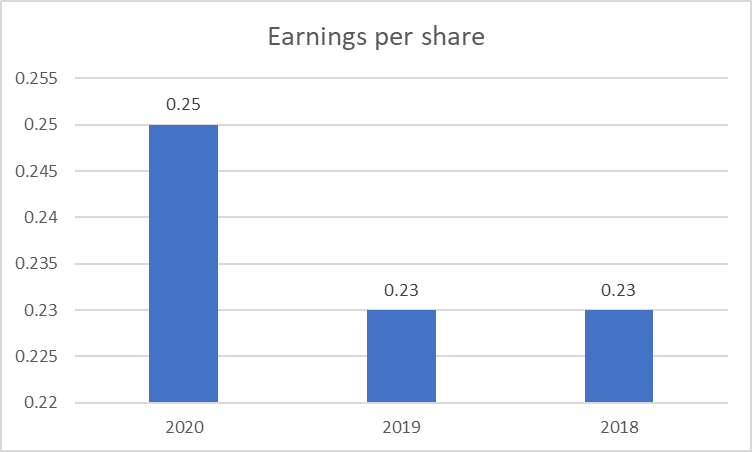
EPS in 2018 and 2019 of T Plc was 0.23 which has been increased to 0.25 in 2020 referring overall upward trend. This trend in T Plc’s EPS implies that the corporation’s efficiency to provide profit to each shareholder has risen over the period 2018-2020. As industry average EPS is not provided which is a limitation of EPS analysis (Pratiwi, Miftahuddin, and Amelia, 2020).
Dividend Yield:
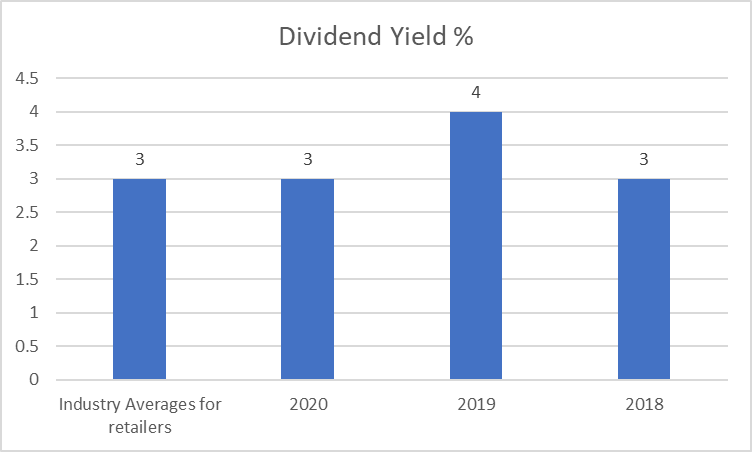
T Plc has not reported any major change in Dividend yield per cent. Also, T Plc’s dividend yield in 2020 is similar to the industry average. The analysis reflects that company is quite efficient to provide returns as dividends to its shareholders (Handayani, and Zulyanti, 2018).
(e) Investment Decision:
The overall aggregate analysis represents that T plc’s profitability position is good as well as improved over the period. Also, the profitability position of T plc is better than the industry average. The considerable aspect here is that T plc’s liquidity position has been declined over the period 2018-2020 as all the liquidity ratios reported an unfavourable trend most likely due to COVID-19 circumstances, sill there is no major decline in liquidity ratios. While working capital ratios show that T plc is faster in terms of turning its stock into sales but in aspects of cash collection from debtor company not performed well. A favourable trend in the Investors ratio of T Plc suggests that the company’s performance has been improved during 2018-2020. Based on the total analysis of each aspect of T Plc’s performance, I would like to invest in T plc although an unfavourable trend in liquidity position is a key concern while other metrics show that the company is capable to improve liquidity position (Kadim, Sunardi, and Husain, 2020).
Conclusion
From the above study, this has been articulated that T plc’s Investment ratios and profitability ratios have reported favorable trend but liquidity and receivable days ratio are not reported favorable trend. But the company’s inventory days ratio has reported favorable trend. There is an adverse trend in liquidity ratio and receivable days due to increasing debt level in COVID-19 circumstances, thus T Plc is recommended to focus on these areas as in the longer term it can impact the company’s solvency position. The company should restructure its debts and revise credit terms with suppliers to minimize overall current liabilities.
References
Books and Journals:
Handayani, R. and Zulyanti, N.R., 2018. Pengaruh Earning Per Share (Eps), Debt To Equity Ratio,(Der), Dan Return On Assets (Roa) Terhadap Return Saham Pada Perusahaan Manufaktur Yang Terdaftar Di BEI. JPIM (Jurnal Penelitian Ilmu Manajemen), 3(1), pp.615-620.
Husain, T. and Sunardi, N., 2020. Firm's Value Prediction Based on Profitability Ratios and Dividend Policy. Finance & Economics Review, 2(2), pp.13-26.
Jana, D., 2018. Impact of working capital management on profitability of the selected listed FMCG companies in India. International Research Journal of Business Studies, 11(1), pp.21-30.
Kadim, A., Sunardi, N. and Husain, T., 2020. The modeling firm's value based on financial ratios, intellectual capital and dividend policy. Accounting, 6(5), pp.859-870.
Laitinen, E.K., 2017. Profitability ratios in the early stages of a startup. The Journal of Entrepreneurial Finance, 19(2), pp.1-28.
Pratiwi, S.M., Miftahuddin, M. and Amelia, W.R., 2020. PENGARUH CURRENT RATIO (CR), DEBT TO EQUITY RATIO (DER), DAN EARNING PER SHARE (EPS) TERHADAP HARGA SAHAM PADA PT. INDOFOOD SUKSES MAKMUR Tbk. Jurnal Ilmiah Manajemen dan Bisnis (JIMBI), 1(2).
Rahman, A.A.A.A., 2017. The relationship between solvency ratios and profitability ratios: Analytical study in food industrial companies listed in Amman Bursa. International Journal of Economics and Financial Issues, 7(2), pp.86-93.
Rukshika, R.N.T., 2019. The value relevance of accounting information on stock market price for the investors’ decision.(With special reference to the financial ratios).
Sari, D.W., 2021. ANALYSIS OF THE EFFECT OF THE LIQUIDITY RATIO ON FINANCIAL PERFORMANCE IN. MULTI BINTANG INDONESIA TBK. International Journal of Global Accounting, Management, Education, and Entrepreneurship, 1(2), pp.78-89.
Sartika, D., Muin, M.R. and Sofyan, D., 2021. The Effect of Liquidity Ratio and Solvency Ratio on the Profitability of Plantation Subsector Companies Listed on the Indonesian Stock Exchange. Husnayain Business Review, 1(1).
Tiruvengadam, N. and Beruvides, M.G., 2020. Total productivity at breakeven: The dynamics between working capital ratio and profits. In 2016 Industrial and Systems Engineering Research Conference, ISERC 2016.


