Task 1:-
You are provided with the Trial Balance of Cygnus Hotels as at 31 December 2020 with additional information. You have been requested to construct the appropriate final accounts for the year ended 31 December 2020.
Cygnus Hotels Trial Balance for the year ended 31 December 2020
|
|
Debit
|
Credit
|
|
|
£ 000
|
£ 000
|
|
Revenue
|
|
22,500
|
|
Opening Inventory
|
1,200
|
|
|
Purchases
|
15,000
|
|
|
Administration expenses
|
1,020
|
|
|
Interest received
|
|
60
|
|
Interest paid
|
1,125
|
|
|
Properties (Cost)
|
49,500
|
|
|
Accumulated Depreciation brought/forward
|
|
9,000
|
|
Long-term investments
|
1,200
|
|
|
Trade receivables
|
720
|
|
|
Cash at bank
|
675
|
|
|
Trade payables
|
|
1,350
|
|
Long-term loan
|
|
14,850
|
|
Share capital
|
|
12,600
|
|
Retained profits (b/f)
|
|
10,080
|
| |
70,440
|
70,440
|
Additional information:
The closing inventory is valued at £1,300,000.
The administration expenses include utility bills of £220,000 which has been paid so far, however the last month’s utility bill is yet to be received and paid. Expenses are treated on a accrual basis.
Irrecoverable debts of £20,000 are to be provided for. A further allowance of 1% of the outstanding balance is also to be provided.
Properties are depreciated over 50 years on a straight line basis. The estimated residual value is £10,000,000.
You are required to prepare the:
Income Statement (13 marks)
Statement of Financial Position (12 marks)
The financial statements should be prepared in the appropriate formats clearly showing the workings for the additional notes and should be submitted as an MSWord document.
Task 2:-
| |
|
|
|
|
| |
Company X
|
|
Company Y
|
|
INCOME STATEMENTS
|
£'000
|
£'000
|
|
£'000
|
£'000
|
|
Turnover
|
|
80,000
|
|
|
110,000
|
|
Opening inventory
|
26,000
|
|
|
20,500
|
|
|
Purchases
|
51,000
|
|
|
90,500
|
|
| |
77,000
|
|
|
111,000
|
|
|
Closing inventory
|
(14,000)
|
|
|
(18,000)
|
|
|
Cost of Sales
|
|
(63,000)
|
|
|
(93,000)
|
|
Gross profit
|
|
17,000
|
|
|
17,000
|
|
Expenses
|
|
|
|
|
|
|
Depreciation
|
(1,200)
|
|
|
(4,000)
|
|
|
Other expenses
|
(9,300)
|
|
|
(4,500)
|
|
| |
|
(10,500)
|
|
|
(8,500)
|
|
Operating profit
|
|
6,500
|
|
|
8,500
|
|
Interest paid
|
|
(500)
|
|
|
(1,000)
|
|
Profit before tax
|
|
6,000
|
|
|
7,500
|
|
Taxation
|
|
(1,400)
|
|
|
(1,700)
|
|
Net Profit
|
|
4,600
|
|
|
5,800
|
| |
|
|
|
|
|
|
Statement of Financial Position
|
|
|
|
|
ASSETS
|
|
|
|
|
|
|
Non-current Assets
|
|
|
|
|
|
|
Equipment at cost
|
12,000
|
|
|
22,500
|
|
|
Depreciation
|
(8,000)
|
|
|
(6,500)
|
|
|
Net Book Value
|
|
4,000
|
|
|
16,000
|
|
Current Assets
|
|
|
|
|
|
|
Inventory
|
14,000
|
|
|
18,000
|
|
|
Receivables
|
22,000
|
|
|
19,000
|
|
|
Bank
|
6,000
|
|
|
3,500
|
|
| |
|
42,000
|
|
|
40,500
|
|
LIABILITIES
|
|
|
|
|
|
|
Current Liabilities
|
|
|
|
|
|
|
Trade payables
|
|
(7,000)
|
|
|
(12,000)
|
|
Non-current Liabilities
|
|
|
|
|
|
|
Bank loan
|
|
(5,000)
|
|
|
(10,000)
|
|
Net Assets
|
|
34,000
|
|
|
34,500
|
| |
|
|
|
|
|
|
CAPITAL
|
|
|
|
|
|
|
Ordinary share capital
|
|
15,000
|
|
|
22,000
|
|
Retained profit
|
|
19,000
|
|
|
12,500
|
| |
|
34,000
|
|
|
34,500
|
| |
|
|
|
|
|
| |
|
|
|
|
|
| |
|
£’000
|
|
|
£’000
|
|
Dividend Paid
|
|
2,250
|
|
|
3,300
|
You are required to:
Write a report comparing the performance of company X and company Y using the relevant ratios, making appropriate recommendations as how performance could be improved. Discuss their relevant strengths and weaknesses of each ratios used.
Requirements of the report
The report should have:
A word count of 1,500 words;
A table of contents and a summary;
A discussion of each ratio explaining its purpose, your observations and your interpretations.
An overall conclusion summarizing your observations in relation to which company is better for investment;
Good spelling and grammar;
Appendices that support your arguments and calculations;
You should clearly show all the formulae and calculations in the appendices. The figures should be rounded to 2 decimal places.
A specified word count of Task 2 refers to the main body of the report and does not include the title page, contents page and appendices.
Both Task 1 and Task 2 are to be completed in the word document.
Answer
Introduction
The study covers 2 key tasks, the first task comprises the preparation of income statement and balance sheet based on the trial balance of Cygnus Hotels. Whereas, the second task covers ratio calculations and analysis to assess the actual performance of Company X and Company Y.
Task 1
Income Statement of Cygnus Hotels:
|
Income Statement for the year ended 31st Dec. 2020
|
|
Particulars
|
|
Amount (‘000)
|
|
Sales
|
|
22500
|
|
Less: Cost of Sales
|
|
|
|
Opening Stock
|
1200
|
|
|
Purchases
|
15000
|
|
|
Less: Closing Stock
|
1300
|
14900
|
|
Gross Profit
|
|
7600
|
| |
|
|
|
Income
|
|
|
|
Interest Received
|
|
60
|
| |
|
|
|
Less: Expenses
|
|
|
|
Administration Expenses (1020-220)
|
|
800
|
|
Interest Paid
|
|
1125
|
|
Allowance for debtors
|
|
7
|
|
Depreciation for properties
|
|
790
|
|
Net Profit
|
|
4938
|
Notes:
Prepaid administration has been deducted from total administration expenses as 1020000 less 220000.
Depreciation has been computed on SLM basis where useful life is 50 years and the residual value is 10000000. So, depreciation would be = (49500000-10000000)/50
Allowance for debtors has been computed after deducting bad debt amounting to 20000, as (720000-20000) *1% = 7000
Statement of Financial Position of Cygnus Hotels:
|
Statement of Financial Position as of 31st Dec. 2020
|
|
Equity and Liabilities
|
|
Amount
|
|
Shareholder's Fund
|
|
|
|
Share Capital
|
12600
|
|
|
Retained Earnings
|
10080
|
|
| |
22680
|
|
|
Net Profit
|
4938
|
27618
|
| |
|
|
|
Long term Borrowings
|
|
|
|
Long-term loan
|
|
14850
|
| |
|
|
|
Current Liabilities
|
|
|
|
Trade Payables
|
|
1350
|
|
Total
|
|
43818
|
| |
|
|
|
Assets
|
|
|
|
Non-current assets
|
|
|
|
Properties (Cost)
|
49500
|
|
|
Less: Accumulated Depreciation brought/forward
|
9000
|
|
| |
40500
|
|
|
Less: Depreciation
|
790
|
39710
|
| |
|
|
|
Long-term investments
|
|
1200
|
| |
|
|
|
Current Assets
|
|
|
|
Trade receivables
|
693
|
|
|
Prepaid administration expenses
|
220
|
|
|
Closing Stock
|
1300
|
|
|
Cash at bank
|
675
|
2888
|
|
Total
|
|
43818
|
Notes:
Properties have been depreciated at SLM basis and actual WDV has been computed after deducting accumulated depreciation and current depreciation from the actual cost of properties,
Net profit amount as shown in Income Statement has been added in Retained earnings and shown under the capital head.
Prepaid administration expense has been shown as current assets.
Trade receivables are shows at value after deduction of bad debt and provision for debtors.
Task 2
Ratio Analysis of Company X and Company Y
Profitability: It covers all ratios which primarily represents a company’s profitability position form different perspective. Here are several crucial profitability ratios, as discussed below:
Gross Profit Ratio:

The aim of the Gross Profit Ratio is to highlight the underlying profitability level of a corporation's business operations. Usually, the larger figure of gross profit percentage is preferred since it signals a stronger opportunity for increased profits. Corporations with a wider gross profit percentage are more positioned to deal with unforeseen rises in direct costs or competitiveness (Aman, 2016). GP ratio of Company X and Y is 21.25 % and 15.45 %. The comparison highlights that Company X with a greater ratio is more efficient in providing profit through its core business activities.
Operating Profit:
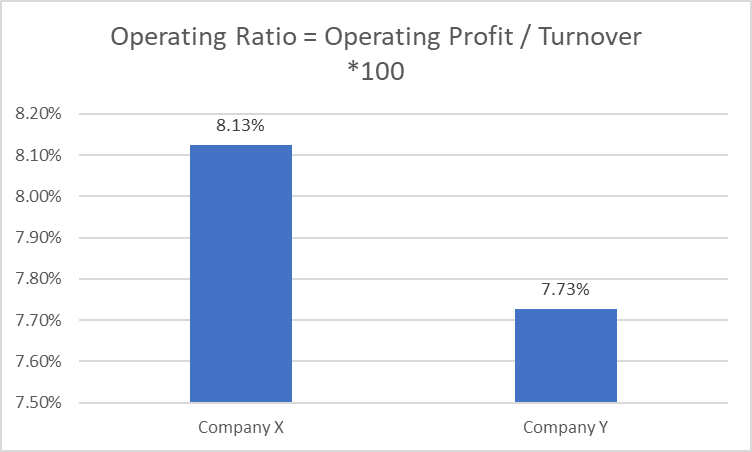
The primary purpose of this ratio is to determine how effectively a corporation manages its operational costs. This is derived by calculating a corporation's profitability by its sales and displaying the resulting proportion as a specific %. The larger the operating profit margin, the superior the corporation's cost management is regarded to be (McCosker, 2021). Operating profit as computed of Company X is 8.13% while of Company Y is 7.73%. Comparatively, Company X with a higher ratio is more effective in generating profit through operating activities i.e., profit before interest and taxation.
Net Profit Ratio:

The primary goal of this percentage is to assess a corporation's level of "performance" in the context of making net income. NP margin is one of most important profitabiltiy metrics since it represents what remains of the income after all expenditures, bills, taxation, as well as other expenditure. In the perspective of profitability, net profit, as well as net income, are interchangeable, as are sales and turnover (Bragg, 2018). Company X’s net profit ratio is 5.75% while Company Y's is 5.27%. Comparision exhibits that Company X has a higher NP ratio indicating that company X is a more profitable company and more efficient to generate profit after deduction of all company expenses.
Return on Asset Ratio:
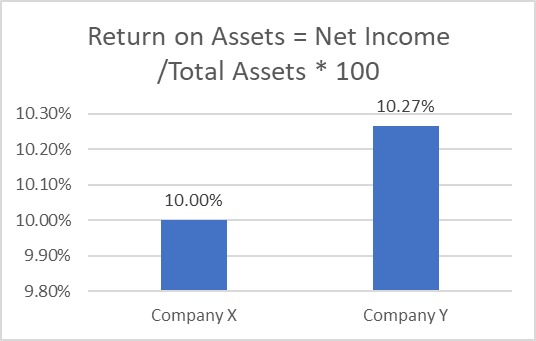
The primary purpose of the Return on Assets ratio is to represent how lucrative a corporation is in proportion to its entire assets. ROA demonstrates how competent the company is in generating profits from its aggregate assets. ROA is represented as a proportion and is determined by dividing yearly earnings/net income by overall assets (SIIMANN, 2018). ROA of Company Y is 10.27% while of Company X is 10.00%. Company Y has a slightly higher ratio as compared to the ROA of Company Y. Comparative analysis shows that Company Y with greater ROA is more profitable in terms of generating net profit through utilizing its aggerate assets.
Return on Equity:
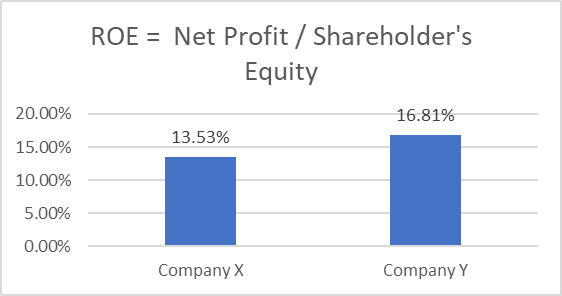
The basic purpose of the ROE ratio is to highlight how much post-tax profit a corporation made in relation to the overall sum of shareholder capital recorded on the business's balance sheet (Amanda and Riyanto, 2020). ROE of Company X is 13.53% and of Company Y is 16.81%. Comparison displays that Company Y with greater ROE is more profitable in relation to generation of net income by utilising overall equity fund.
Efficiency: This covers a set of ratios that are useful in highlighting actual efficiency of business through different perspectives like the collection of debtors, payments to creditors, utilisation of business resources etc. Here below is the discussion about key efficiency ratios in the context of Company X and Y, as follows:
Asset Turnover Ratio:
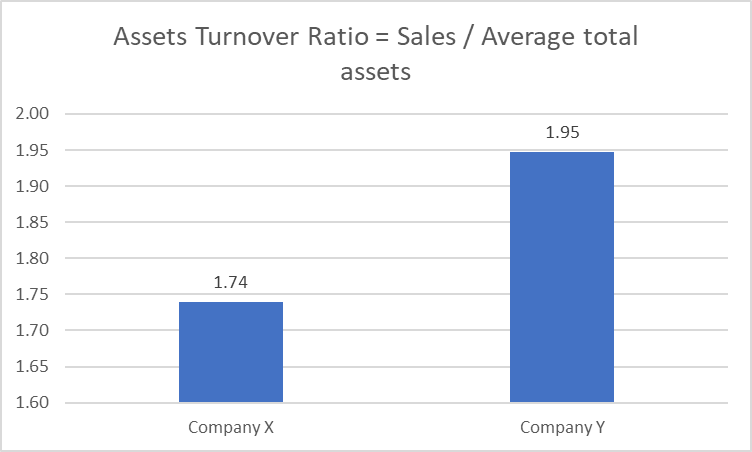
The asset turnover ratio's aim is to measure how efficiently a corporation employs all business assets to produce earnings. The proportion is derived by dividing overall sales for a reporting period by the aggregate average value of business assets possessed by the organization throughout the term (Chalu and Lubawa, 2018). The average amount is determined by combining the value of assets held by the firm at the start of the year to asset value held at the ending of year then divide by 2. Company X and Company Y have an Asset turnover ratio of 1.74 and 1.95 respectively. The comparison shows that Company Y has a higher ratio which implies that company Y is comparatively more efficient in generating sales by utilising its aggerate assets.
Inventory Turnover Ratio:
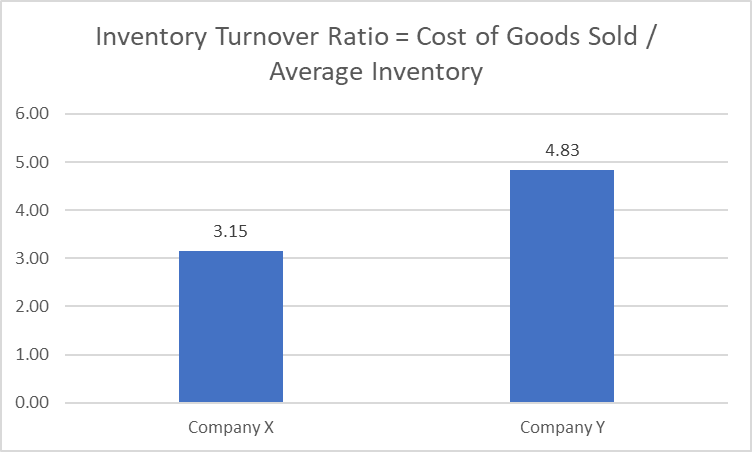
The purpose of the inventory turnover ratio is to represent how many times inventories are sold and subsequently replenished in a certain time frame. Recognizing inventory turnover ratio is a crucial indicator of business success, cost management, including sales that could be matched to other corporations in the same sector. The inventory turnover ratio of Company X and Y are 3.15 and 4.83. Company Y has a higher ratio which exhibits that company Y is more efficient in converting business inventory into sales.
Receivable Turnover Ratio:
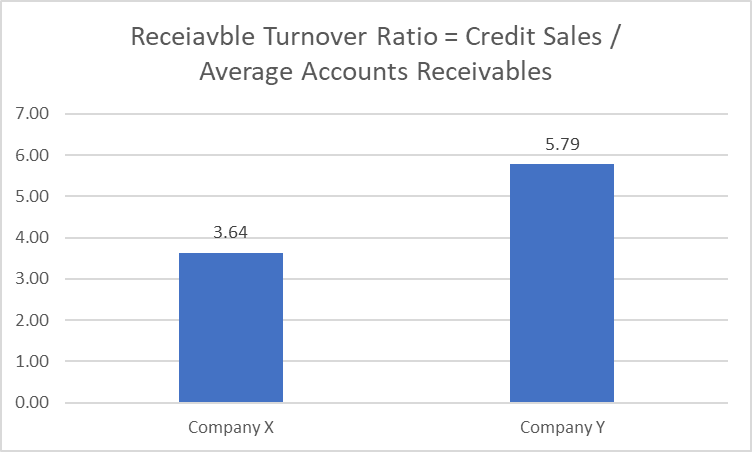
The goal of this ratio is to assess how effectively the corporation's assets, as well as other resources, are handled and utilized. Trade Receivable Turnover ratio is determined by dividing Net overall Credit Sales by an average number of outstanding receivables. This proportion is widely applied to assess the effectiveness of cash receipts (Jayanti, 2019). Company Y has a receivable turnover ratio of 5.79 while the ratio of company X is 3.64. This shows that Company Y has a greater receivable turnover ratio as compared to Company X. Thus, Company Y is more effective in the collection of accounts receivables as well as increased cash flows.
Accounts Payable turnover Ratio:
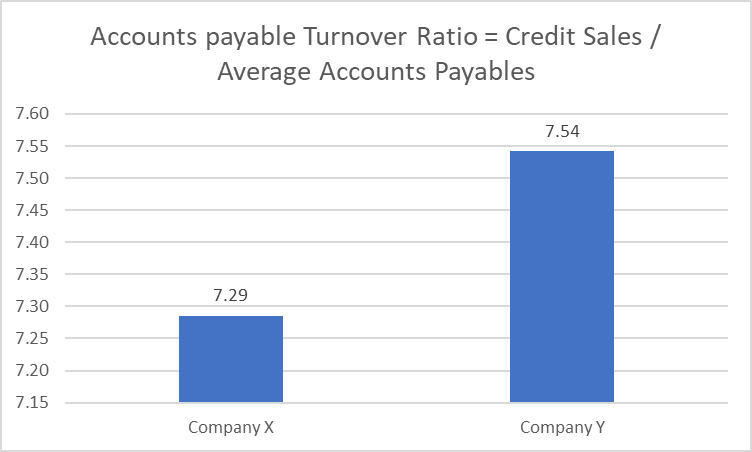
Accounts payable turnover is a proportion derived from the mean no. of times a corporation pays its suppliers/payables over the course of a reporting year. It assesses a company’s short-range liquidity. Net credit total purchases are divided by mean accounts payable to determine trade payable turnover ratio (Dempsey, 2019). Company X and Y has Accounts payable turnover of 7.29 and 7.54 respectively indicating that company Y has a greater ratio as compared to company X. Comparison reflects that company Y is quicker as well as more capable to pay its trade payables.
Fixed Assets turnover Ratio:
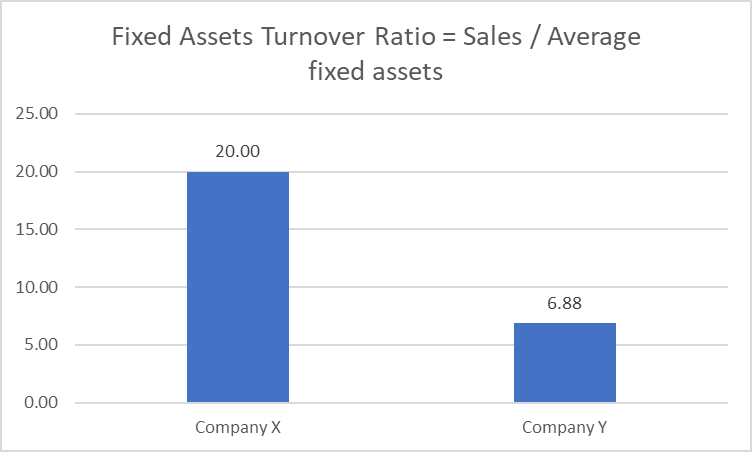
FA Turnover Ratio's purpose is to assess a company's ability to generate revenues out of its capital spending. A firm with many productive overall fixed assets, including plants, machines, vehicles, including large equipment, may function at various capacities, as well as its revenues will either rise or drop based on the efficacy of its procedures and its capacity to create and sale products (Komikov, 2019). The fixed-asset turnover ratio of company X and Y are 20 and 6.88. Comparison points that Company X with a greater ratio is more efficient to generate sales using its fixed assets.
Based on the overall analysis of Companies X and Y this has been articulated that all the efficiency ratios of Company Y are better than the Company X. Further, ROA and ROE ratio outcomes of Company Y are also better than Company Y. Although, GP Margin, Operating Profit Ratio and NP ratio of Company X is slightly greater than that of Company Y but there are no major differences. Based on the comparison of all ratios of Company X and Y this has been concluded that Company Y has better performed as compared to Company X (Agustina and Suprayitno, 2020).
Conclusion
Based on the above study this has been asserted that accounting is a key aspect in business that involves reporting all relevant financial information in effective manners such as income statement and balance sheet. While finance involves the assessment of the actual performance of a company using a key technique like ratio computation and analysis. As in task 2 from the comparison of ratios of company X and Y, this has been analyzed that company Y has performed well comparatively
References
Books and Journals:
Agustina, Y.N. and Suprayitno, H., 2020. ANALYSIS OF FINANCIAL STATEMENTS USING LIQUIDITY RATIO TO MEASURE FINANCIAL PERFORMANCE IN 2017-2019. JOSAR (Journal of Students Academic Research), 5(2), pp.32-39.
Aman, S.M., 2016. Analysis of financial statements using ratio analysis for the last 5 years.
Amanda, Y. and Riyanto, S., 2020. ANALYSIS Analysis Of Influence On Pt. Astra Agro Lestari Tbk Financial Performance In Measuring Financial Statements In 2018-2019 Period. Journal of Social Science, 1(4), pp.178-184.
Bragg, S.M., 2018. The Interpretation of Financial Statements. AccountingTools, Incorporated.
Chalu, H. and Lubawa, G., 2018. Using financial statements to analyze the effects of multiple Borrowings on SMEs financial performance in Tanzania. Inter. J. Res. Methodol. Soc. Sci, 1(4), pp.87-107.
Dempsey, M., 2019. Accounting statements and ratio analysis. In Investment Analysis (pp. 77-108). Routledge.
Jayanti, E., 2019, August. Analysis of Financial Statements to Assess Financial Performance of Cooperative Loan in Gianyar Regency. In ICTMT 2019: Proceedings of the First International Conference on Technology Management and Tourism, ICTMT, 19 August, Kuala Lumpur, Malaysia (p. 165). European Alliance for Innovation.
Komikov, S.V., 2019. FINANCIAL STATEMENTS INTEGRAL PARTS: ANALYSIS. Инновационное развитие, (3), pp.46-47.
McCosker, P., 2021. Interpretation of Financial Statements. In Financial and Managerial Aspects in Human Resource Management: A Practical Guide. Emerald Publishing Limited.
SIIMANN, P., 2018. Usage of Efficiency Matrix in the Analysis of Financial Statements. Yayımlanmış Doktora Tezi, Tallinn University of Technology School of Business and Governance Department of Business Administration, Tallinn.
Appendix
Ratio Calculations:
|
Gross Profit Ratio
|
Company X
|
Company Y
|
|
Turnover
|
80000
|
110000
|
|
Gross Profit
|
17000
|
17000
|
|
GP Ratio = GP / Turnover *100
|
21.25%
|
15.45%
|
| |
|
|
|
Operating Ratio
|
Company X
|
Company Y
|
|
Operating Profit
|
6500
|
8500
|
|
Turnover
|
80000
|
110000
|
|
Operating Ratio = Operating Profit / Turnover *100
|
8.13%
|
7.73%
|
| |
|
|
|
Net Profit Ratio
|
Company X
|
Company Y
|
|
Net Profit
|
4600
|
5800
|
|
Turnover
|
80000
|
110000
|
|
Net Profit Ratio = NP / Sales * 100
|
5.75%
|
5.27%
|
| |
|
|
|
Return on Assets
|
Company X
|
Company Y
|
|
Net Profit
|
4600
|
5800
|
|
Total Assets
|
46000
|
56500
|
|
Return on Assets = Net Income /Total Assets * 100
|
10.00%
|
10.27%
|
| |
|
|
|
Return on Equity
|
Company X
|
Company Y
|
|
Net Profit
|
4600
|
5800
|
|
Shareholder's Equity
|
34000
|
34500
|
|
ROE = Net Profit / Shareholder's Equity
|
13.53%
|
16.81%
|
|
Assets Turnover Ratio
|
Company X
|
Company Y
|
|
Sales
|
80000
|
110000
|
|
Average total assets
|
46000
|
56500
|
|
Assets Turnover Ratio = Sales / Average total assets
|
1.74
|
1.95
|
| |
|
|
|
Inventory Turnover Ratio
|
Company X
|
Company Y
|
|
Cost of Goods sold
|
63000
|
93000
|
|
Average Inventory
|
20000
|
19250
|
|
Inventory Turnover Ratio = Cost of Goods Sold / Average Inventory
|
3.15
|
4.83
|
| |
|
|
|
Receivable Turnover Ratio
|
Company X
|
Company Y
|
|
Credit Sales
|
80000
|
110000
|
|
Average Accounts Receivables
|
22000
|
19000
|
|
Receivable Turnover Ratio = Credit Sales / Average Accounts Receivables
|
3.64
|
5.79
|
| |
|
|
|
Accounts Payable Turnover Ratio
|
Company X
|
Company Y
|
|
Credit Purchases
|
51000
|
90500
|
|
Average accounts payables
|
7000
|
12000
|
|
Receivable Turnover Ratio = Credit Sales / Average Accounts Payables
|
7.29
|
7.54
|
| |
|
|
|
Fixed Assets Turnover
|
Company X
|
Company Y
|
|
Sales
|
80000
|
110000
|
|
Total Fixed Assets
|
4000
|
16000
|
|
Assets Turnover Ratio = Sales / Average fixed assets
|
20.00
|
6.88
|


