1. General Assessment Guidance
Your summative assessment for this module is made up of this Coursework submission which accounts for 100% of the marks
∙ Please note late submissions will not be marked.
∙ You are required to submit all elements of your assessment via Turnitin online access. Only submissions made via the specified mode will be accepted and hard copies or any other digital form of submissions (like via email or pen drive etc.) will not be accepted. \
∙ For coursework, the submission word limit is 1,050 words. You must comply with the word count guidelines. You may submit LESS than 1,050 words but not more
∙ Do not put your name or contact details anywhere on your submission. You should only put your student registration number (SRN) which will ensure your submission is recognised in the marking process.
∙ A total of 100 marks are available for this module assessment, and you are required to achieve minimum 50% to pass this module.
∙ You are required to use only Harvard Referencing System in your submission. Any content which is already published by other author(s)
and is not referenced will be considered as a case of plagiarism.
You can find further information on Harvard Referencing in the online library on the VLE. You can use the following link to access this
information: http://bpp.libguides.com/Home/StudySupport ∙ BPP University has a strict policy regarding authenticity of assessments. In
proven instances of plagiarism or collusion, severe punishment will be imposed on offenders. You are advised to read the rules and
regulations regarding plagiarism and collusion in the GARs and MOPP which are available on VLE in the Academic registry section.
∙ You should include a completed copy of the Assignment Cover sheet. Any submission without this completed Assignment Coversheet may
be considered invalid and not marked.
2. Assessment Brief 2.1. Scenario
You have recently been employed as a data analyst in a consultancy called Wood From the Trees (WFTT). The consultancy was established
10 years ago and specialises in helping companies that don’t have the skills to analyse data to support business decisions. WFTT has
successfully established a strong reputation and they are now working with internationally recognised brands.
As WFFTs expands they continue to bring in new employee’s. The recruitment strategy is to employ less experienced people and give them
the support and development they need to succeed in the company. They like recruits to have a broad management experience and not be
specialist analysts because they offer more commercially viable recommendations.
As part of the approach to introducing you to how the company works WFFT have asked you to complete a number of initial tasks to ensure
that you have a grounded knowledge and understanding of the company. This is your opportunity to demonstrate your capability and give
them the confidence to let you run your own project in the future. The responses to requests detailed below should be included in a
summary Word report that you save and submit in a PDF file.
2.2. Formative
Week 1
1. Summarise the key changes and trends that are leading to the increased importance of data analysis in companies 250 words. 10 Marks
Week 2
WFTT have recently taken on a new client – they are mid-sized high-end luxury international jewellery chain called Bangles. The first phase
of the project for Bangles is to understand the performance of the company. To do this you have been asked to define the data request to
be sent to Bangles. A data request is a table that lists the data you would like Bangles to send and which will then be used for the analysis.
As an example – the data request is expected to include sales by key category by month by market (e.g United Kingdom)
2. Produce a summary table that describes the data and the business function within Bangles that you expect to be responsible for
providing this data. Your line manager has indicated that they expect you to cover both financial and non financial data and at least 6
different types of data be requested (for example sales, profit) 250 words. 10 Marks
Week 3
Bangles has provided an extract of data – which your line manager has made available to you in a spreadsheet (see separate Excel file). You
have been asked to complete an initial review of the data and to create relevant descriptive statistics
3. Highlight any issues you can see in the data – and describe how you identified them. Justify what you will do to resolve each issue that
you identify 150 words. 10 marks
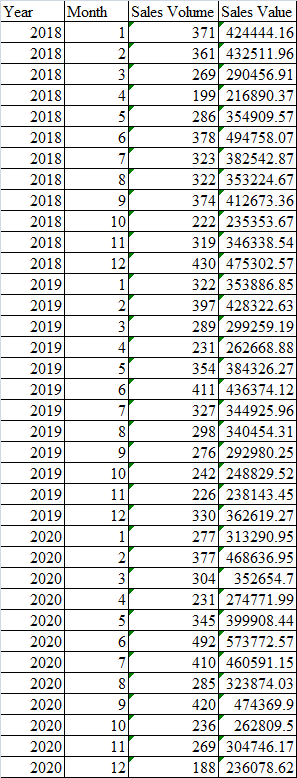
4. Create the following statistics
A. Total volume and sales value by month
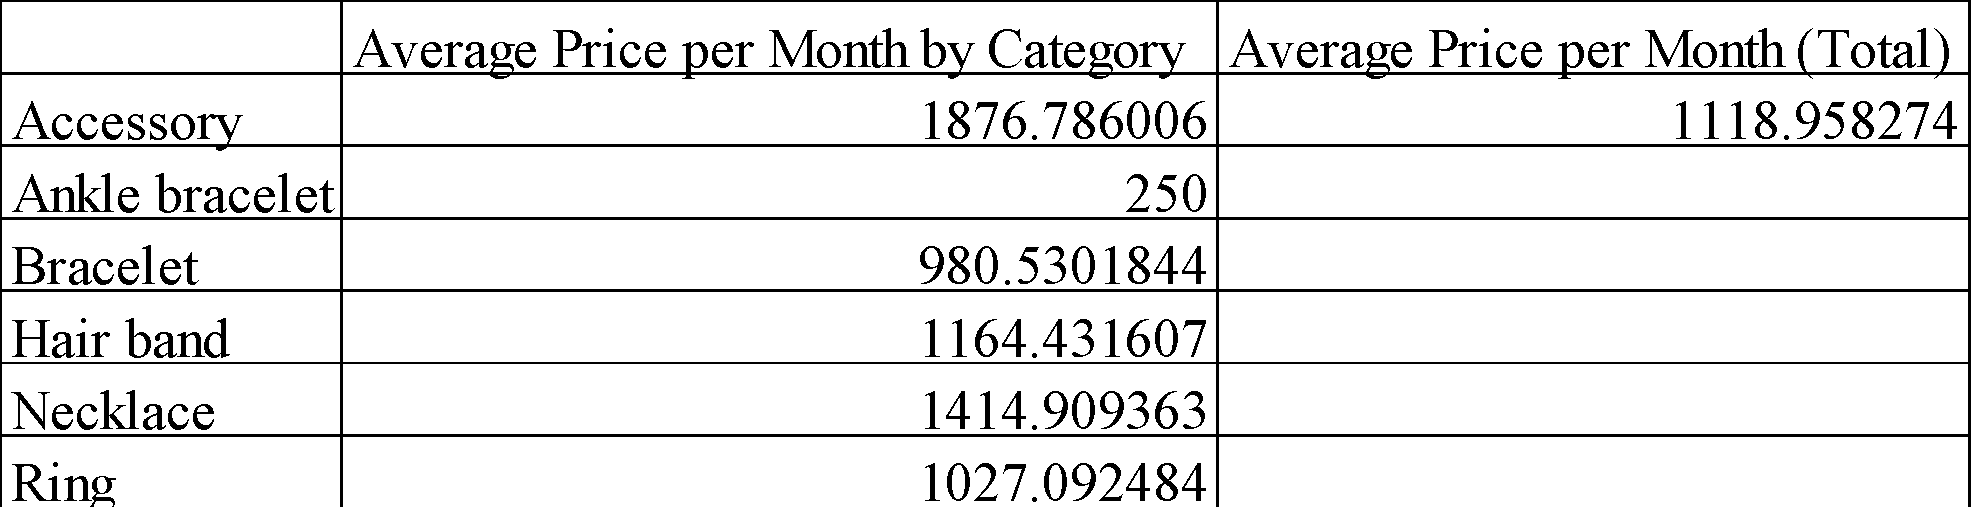
B. Average prices per month by category and total
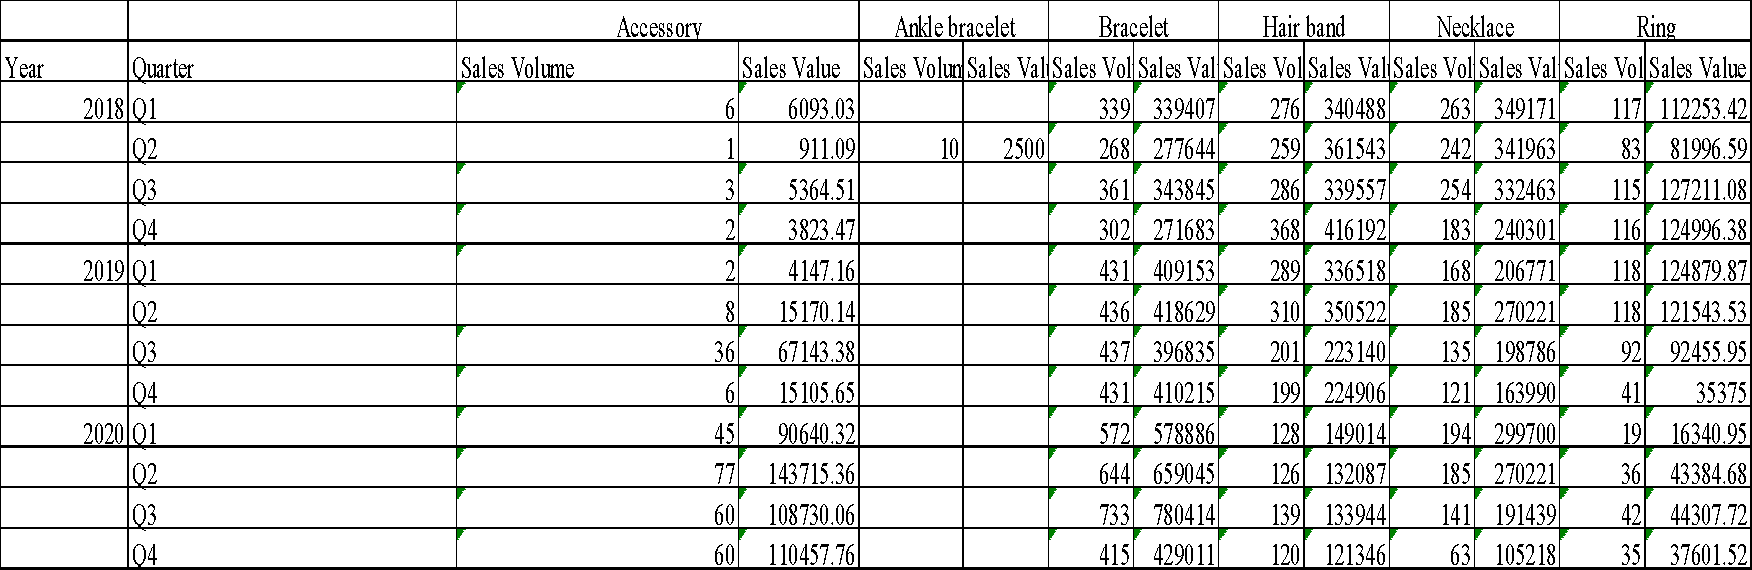
C. Total volume and sales by category and total by year and by quarter
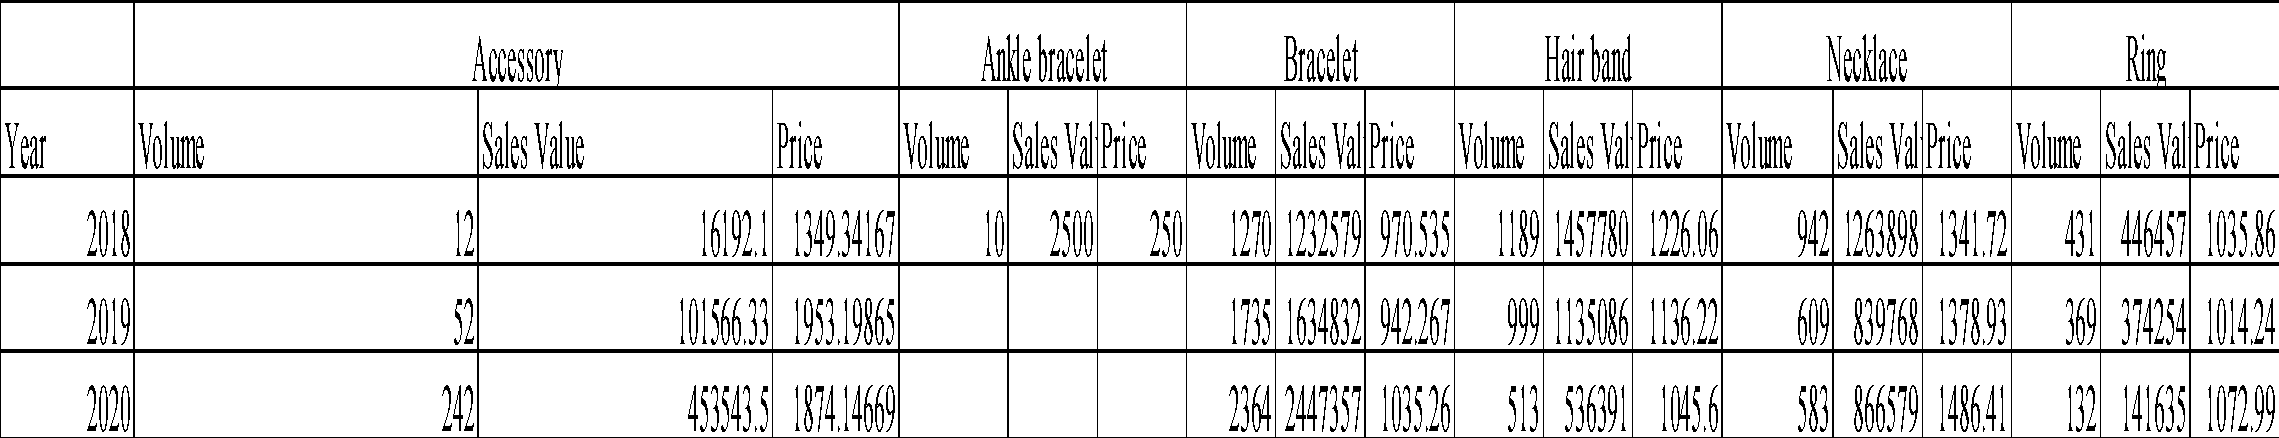
D. Year on year volume, sales value and average price by category and total Include a summary table of C and D in your report
20 marks
Week 4
A key step in any project that your company delivers is to take the data and present it back to the client in a visual form. Your line manager
has asked you to complete this work
5. Using the descriptive statistics that you have calculated in your answer to part (4) create up to 4 charts to visualise the data and copy
these charts into the submission. You need to have at least 1 example of the following types of chart
a. At least one of your charts needs to use a secondary axis (e.g. the chart needs to have a line and bar shown on separate axes)
b. A stacked bar chart 30 marks
6. Include a short commentary for each chart that explains what is being presented, why it matters and highlights any follow up questions
you think are relevant 400 words. 20 marks
Answer
Week 1
1. Importance of Data Analysis Techniques in context of business
Organizations' fundamental priority is to develop value for its all-substantial stakeholders Organizations have grown into progressively specialized structures during the previous few years as a consequence of growing technological usage. Such transition could be found in a range of market segments Organizations can analyze each aspect of business as well as undertake suitable measures to develop and strengthen worth by evaluating numerous data sets throughout each business function. Data analysis delivers major insight into current business scenarios and provides relevant details for future moves (Duan and Xiong, 2015).
People nowadays are also becoming continuously interconnected via portable devices and laptops which creates a tremendous amount of data (called as Big data) concerning their identifications and inclinations. Organizations are utilizing such data to enhance their branding as well as, as an outcome, enhance customer trust and loyalty for business and its products. Likewise, fast advancements in electronics and software development bring new facets, and also new complications and potentials to the manner they utilize relevant data. Data analytics concept is most vital and crucial component of conducting business since it comprises reviewing data and reporting it to managers in the format of stats and reports.
Organizations may utilize data analysis concept to anticipate client behaviors, likes and dislikes and then adjust their marketing approach as appropriate. As a result, the business's incomes rise, and decision-making attempts become more efficient. Data analysis practices assists businesses in strengthening client focused deliveries, recognizing new clients for their marketplace classifications introducing innovative concepts reducing productivity as well as operational costs, and resolving difficulties encountered when advertising their product lines A wide range of trends related to data analytics are impacting how a business operates or functions.
Augmented Analytics: Augmented Analytics streamlines data preparation processes for analysis through labelling and categorizing it employing AI algorithms. Herein, AI also allows analytics through making the procedure of uncovering new findings easier. Without the need for a particular user issue, this could reveal interesting tendencies and observations.
Enhanced and improved Data Maintenance: In data analytics, identified patterns and insights assist in the digitalisation of relevant data maintenance owing to the numerous types of data supplied in modern enterprises and companies
Always On' Analytics: Data analytics pattern and key insights assist to integrate data analysis process with real corporate processes.
Graphical Analytics: As companies acquire information/facts through a variety of resources, graphical analytics enables managers to interpret the input in the manner of a graphical charts.
Week 2
2. Summary Table:
|
Data
|
Business Functions
|
|
Total Profit
|
The aggregate profit sum produced by the enterprises act an important aspect for assessing the sustainability and performance of the business of Bangle's. The overall profit produced aids in contrasting the entity's functioning to those of its major competitors and then also serves in recognising key areas of business that need more emphasis.
|
|
Employee turnover
|
Bangles' capacity to retain personnel in the company may be evaluated by evaluating employee or labour turnover It also demonstrates the company's efficient operations.
|
|
Consumer Feedback
|
The total of customer grievances filed by Bangles will help to determine the customer's degree of satisfaction with the enterprise. The fewer number of complaints, the greater the firm's efficacy in serving customers (Cagle, Yılmaz and Doğru, 2019).
|
|
Rise in sale of product lines
|
The growth in sales of product categories represents the increase in sales of a company's product categories over a defined time period. To assess and contrast the business Bangle's progress and operating, its Increase in Sales percent may be reviewed and matched to the preceding year level.
|
|
Human Resource Management
|
Bangles entity human resource management must consider the business's environments as well as how well they choose the suitable staff for the reasonable status.
|
|
Income and Expenses
|
An enterprise's incomes is the total level of earnings made by the business through the selling of product lines. This includes the company's net sales of its product categories. By analyzing the incomes and expenditures of the company's product lines, Bangle's may have a better knowledge of how the company operates in the UK’s jewellery sector.
|
Week 3
3. Issues in Data:
The key issue identified in the given data set is that this is unorganised which makes the interpretation difficult for business. Also, in given data, sales volume of Accessory is minus one which make interpretation wrong. For effective interpretation of data, one is required to arrange data by sorting and filters. The arranged data then used to prepare charts and graphs. Frist here in given data set data should be separated year wise then arrange them in month wise such that a comprehensive chart of year and month wise sales of different products both value wise and volume wise. Thus, issue of unarranged data can be solved by classification and
segregation of data by key labels like years, months, products, sale value and sale volume (Mijač, Jadrić and Ćukušić, 2018).
4. Statistics and Calculations
Total volume and sales value by month:
Average prices per month by category and total
Total volume and sales by category and total by year and by quarter
Year on year volume, sales value and average price by category and total
Week 5
5. Graphs or Charts
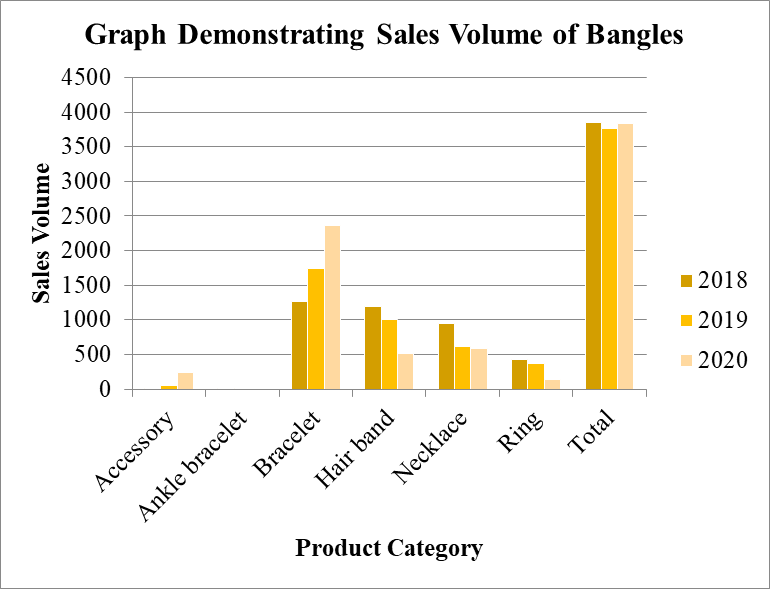
Graph for Sales Volume of Bangles:
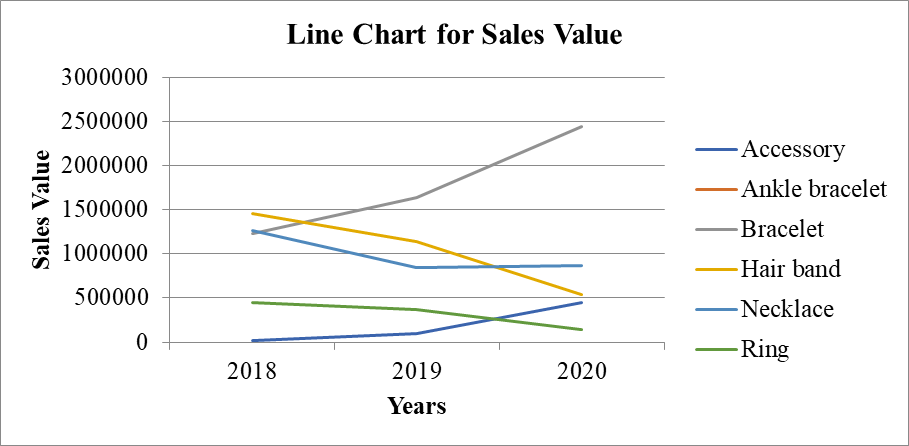
Graph for Sales Value of Bangles:
Stacked Bar Graph for Total Price:

Graph for Monthly Average Price of Different Products:

Week 6
6. Commentary
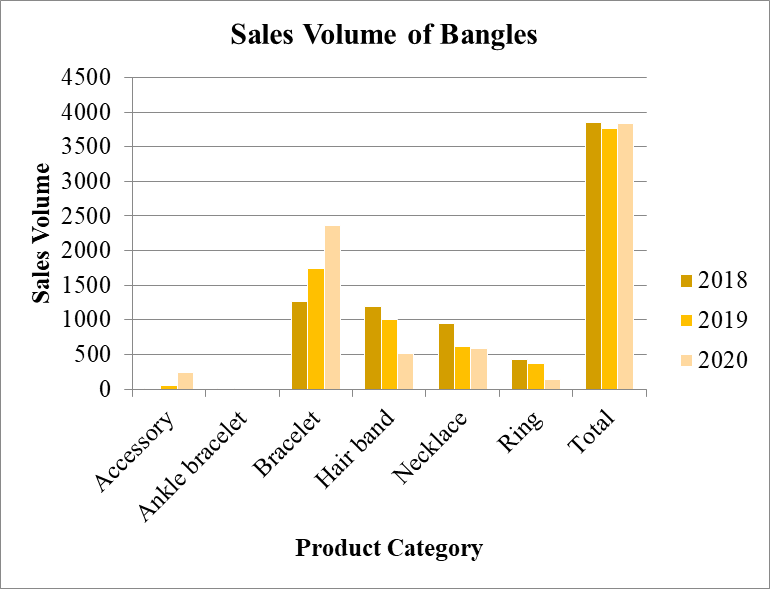

The chart demonstrates that there is a rise or growth in the overall sales volumes of two sorts of product lines. Accessories and bracelets are examples of such goods. During 2018, Bracelet product had sales volume at 1270. But by ending of 2020, the total value of such product's sales volume had risen to 2364. Throughout 2018, total sales volume of accessories was reported at 12. In 2020, the number of accessories sold will have grown to 242. This increases the sales trend of Bangles between year 2018 to year 2020 for only two items: accessories and Bracelet). Simultaneously, a considerable drop in total sales volume results of Bangles business for major products such as Ankle-bracelets, Hair-Band, Necklaces, and Rings is observed. The following chart also shows the overall Bangle's sales quantity has fallen from level of 3854 during 2018 to the level of 3834 in 2020 (Anda, Isah and Aminu, 2017).
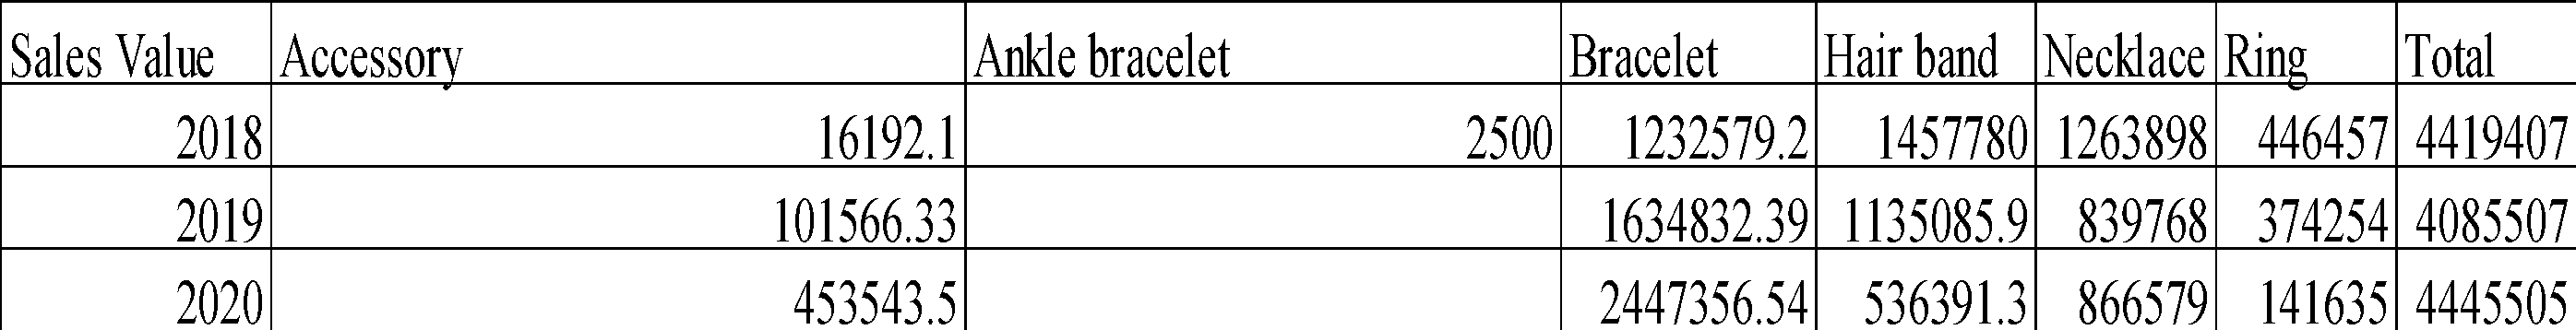
According to the graphic image, sales growth of Bangles business in respect of monetary price has risen for just two items: accessories and Bracelet. Also, the data reveals that the total sales of accessories has risen from the level of 16192 during 2018 to level of 453543 in 2020. Similarly, the total sales of product bracelet has grown from level of 1232579 during 2018 to level of 2447356 in year 2020. Simultaneously time, abovementioned table demonstrates a drop in the corporation's sales volumes for the remaining goods such as rings, necklaces, hair bands, and ankle bracelets. The figure, on the other hand, shows that the overall sales of product Bangles has been grown from level of 4419407 during 2018 to level of 4445505 in 2020.

According to the figure and tables above, the overall price level of accessories has increased from level of 1349 for 2018 to level 1874 for year 2020. Simultaneously time, the overall Bracelet price has risen from level of 970 during 2018 to level of 1035 in 2020. From period 2018-2020, the overall price of product Necklace as well as Ring items rose as well. However, the overall price of product Hair Band is expected to fall from level of 1226 in year 2018 to level of 1045 in 2020. Based on this facts and facts it could be stated that total price element seems to have no substantial effect on the selling efficacy of Bangles (Thorstad and Wolff, 2018).
|
|
Average Price per Month by Category
|
|
Accessory
|
1876.786006
|
|
Ankle bracelet
|
250
|
|
Bracelet
|
980.5301844
|
|
Hair band
|
1164.431607
|
|
Necklace
|
1414.909363
|
|
Ring
|
1027.092484
|
The accompanying tables and graphic show that the mean monthly price level of various items varies by product category. The mean monthly price level for products: ring, necklaces, hair band, bracelets, ankle bracelets, and accessory are 1027, 1414.00, 1164.00, 980.00, 250.00, as well as 1876.00, respectively. Based on this statistics, it can be claimed that month wise average price of various items has no significant impact on the business's sales generation efficiency (Jeble, Kumari and Patil, 2017). The below are several follow-up queries to address for improved decision making process in the framework of given organization:
-
Does the business spend in promotional deals?
-
What are business's core advertising or marketing strategies?
-
What are the sources of revenue generation with respect to various products?
-
What is the key cause for the lack of sales statistics for the Ankle Bracelets category?
-
References
Books and Journals:
Anda, I., Isah, O.R. and Aminu, E.F., 2017. A safety data model for data analysis and decision making.
Cagle, M.N., Yılmaz, K. and Doğru, H., 2019. Digitalization of Business Functions under Industry 4.0. Digital Business Strategies in Blockchain Ecosystems: Transformational Design and Future of Global Business, p.105.
Duan, L. and Xiong, Y., 2015. Big data analytics and business analytics. Journal of Management Analytics, 2(1), pp.1-21.
Jeble, S., Kumari, S. and Patil, Y., 2017. Role of big data in decision making. Operations and Supply Chain Management: An International Journal, 11(1), pp.36-44.
Mijač, T., Jadrić, M. and Ćukušić, M., 2018, May. The potential and issues in data-driven development of web personas. In 2018 41st International Convention on Information and Communication Technology, Electronics and Microelectronics (MIPRO) (pp. 1237-1242). IEEE.
Thorstad, R. and Wolff, P., 2018. A big data analysis of the relationship between future thinking and decision-making. Proceedings of the National Academy of Sciences, 115(8), pp.E1740-E1748.


